Go: Debugging memory leaks using pprof
Introduction
I work as a software engineer at OVO Energy where my team are implementing the CRM solution used by customer services. We’re currently building a new set of microservices to replace the existing services. One of our microservices is responsible for migrating data from the old system into the new one.
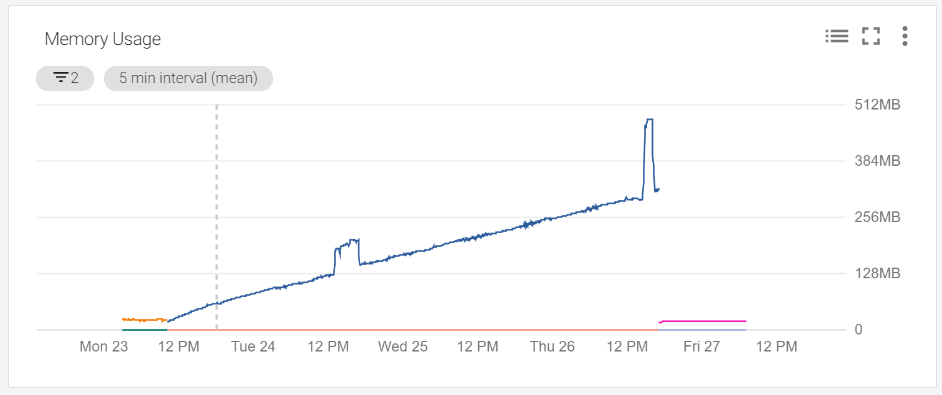
A few days after deploying a new version of the service, I opened the relevant monitoring dashboard and saw this:

According to this graph, we have a memory leak somewhere. This is most likely due to an issue with the management of goroutines within the service. However, the service relies heavily on concurrency, so finding where the leak is might not be so easy. Luckily, goroutines are lightweight, allowing a reasonable amount of time to figure out where the leak is before it becomes a real/expensive problem. The two spikes on the 12pm marks are times when migrations occurred.
Background
Over the course of a few weeks I designed and implemented the service and hosted it in our Kubernetes cluster on GCP, ensuring that I added monitoring functionality in order to make it ready for production. This included an HTTP endpoint for health checks, log-based metrics and uptime checks using Stackdriver.
This service has to communicate with a handful of external dependencies, these are:
- Apache Kafka - Kafka allows services to publish and subscribe to streams of records, similar to a message queue or enterprise messaging system. An event is published from another service to signify that a customer is ready for us to migrate.
- Confluent Schema Registry - The registry allows us to apply versioned schemas to our Kafka events and is used to decode messages from Apache Avro format into its JSON counterpart.
- PostgreSQL - A relational database used to store information on the migration of a customer (records created, any errors and warnings etc).
- Two Salesforce instances - These are where the customer support staff work on a day-to-day basis. One containing the source of the V1 data and one to store the new V2 data.
From all these dependencies, we have a health check that looks something like this:
{
    "status": "UP",
    "uptime": "22h54m27.491102074s",
    "goroutines": 24,
    "version": "go1.9.7",
    "sf1": {
        "status": "UP"
    },
    "sf2": {
        "status": "UP"
    },
    "database": {
        "status": "UP"
    },
    "kafka": {
        "status": "UP"
    },
    "registry": {
        "status": "UP"
    }
}
First thing I would note, using runtime.NumGoroutine() to see the number of running goroutines is extremely helpful in identifying the source of the memory leak. I recommend having some way to monitor this in your production environments. In this scenario, our HTTP health check returns the number of running goroutines.
On the day of the leak, I saw the number of goroutines exceed 100000 and keep rising steadily with each health check request. Below are the steps I took in debugging this issue.
Enabling pprof output via HTTP
The pprof tool describes itself as “a tool for visualization and analysis of profiling data”, you can view the GitHub repository for it here. This tool allows us to obtain various metrics on the low-level operations of a Go program. For our purposes, it allows us to get detailed information on running goroutines. The only problem here is that pprof is a binary. This means we would have to run commands against the service in production for meaningful results. The application also runs within a Docker container based on a scratch image, which makes using the binary somewhat invasive. How then can we get the profiling data we need?
The net/http/pprof package within the standard library exposes pprof methods for providing profiling data via HTTP endpoints. This project uses mux as its url router, so exposing the endpoints can be done using the HandleFunc and Handle methods:
// Create a new router
router := mux.NewRouter()

// Register pprof handlers
router.HandleFunc("/debug/pprof/", pprof.Index)
router.HandleFunc("/debug/pprof/cmdline", pprof.Cmdline)
router.HandleFunc("/debug/pprof/profile", pprof.Profile)
router.HandleFunc("/debug/pprof/symbol", pprof.Symbol)

router.Handle("/debug/pprof/goroutine", pprof.Handler("goroutine"))
router.Handle("/debug/pprof/heap", pprof.Handler("heap"))
router.Handle("/debug/pprof/threadcreate", pprof.Handler("threadcreate"))
router.Handle("/debug/pprof/block", pprof.Handler("block"))
Once I had added these handlers, I span up a local instance of the service and navigated to the /debug/pprof/goroutine endpoint.
Understanding pprof output
The response I got from /debug/pprof/goroutine was fairly easy to interpret, here’s a sample that shows the routines span up
by the Kafka consumer.
goroutine profile: total 25
2 @ 0x434420 0x4344e5 0x404747 0x40451b 0x8a25af 0x8f2486 0x8ee88c 0x461d61
#	0x8a25ae	/vendor/github.com/Shopify/sarama.(*Broker).responseReceiver+0xfe
      /vendor/github.com/Shopify/sarama/broker.go:682
#	0x8f2485	/vendor/github.com/Shopify/sarama.(*Broker).(/vendor/github.com/Shopify/sarama.responseReceiver)-fm+0x35
      /vendor/github.com/Shopify/sarama/broker.go:149
#	0x8ee88b	/vendor/github.com/Shopify/sarama.withRecover+0x4b
      /vendor/github.com/Shopify/sarama/utils.go:45
The first line tells us the total number of running goroutines. In this example, I was running a version of the service
which had fixed the memory leak. As you can see we have a total of 25 running goroutines. The following lines tell us how many
goroutines belong to specific package methods. In this example, we can see the .responseReceiver method from the Broker type in the sarama package is currently using 2 goroutines. This was the silver bullet in locating the culprit of the leak.
In the leaking version of the service, two particular lines stand out that have an ever increasing number of active goroutines.
14 @ 0x434420 0x444c4e 0x7c87fd 0x461d61
#	0x7c87fc	net/http.(*persistConn).writeLoop+0x15c	C:/Go/src/net/http/transport.go:1822

14 @ 0x434420 0x444c4e 0x7c761e 0x461d61
#	0x7c761d	net/http.(*persistConn).readLoop+0xe9d	C:/Go/src/net/http/transport.go:1717
Somewhere in the code we’re creating HTTP connections that are stuck in a read/write loop. I decided to take a look into the source code of the standard library to understand this behavior. The first place I looked was the location at which these routines are spawned. This is within the net/http/transport.go file, by the dialConn method. The full contents of which can be viewed here
// transport.go:1234

pconn.br = bufio.NewReader(pconn)
pconn.bw = bufio.NewWriter(persistConnWriter{pconn})
go pconn.readLoop() // <- Here is the source of our leak
go pconn.writeLoop()
return pconn, nil
Now that we’ve identified where our leak is coming from, we need to understand what scenario is causing these goroutines to never return. I noticed that the number of goroutines only increased after a health check. In the production system, this was happening approximately once a minute using Stackdriver’s uptime checks from different regions.
After a little bit of searching, I determined the source of the leak was during our request to the Confluent schema registry to assert its availability. I had made some rather naive mistakes when writing this package. First off, here’s the New method that creates the client for the registry:
func New(baseURL, user, pass string, cache *cache.Cache) Registry {
return ®istry{
baseURL: baseURL,
username: user,
password: pass,
cache: cache,
client: &http.Client{},
}
}
Error number one, always configure your http clients with sensible values. This issue can be half resolved by the inclusion of a timeout:
func New(baseURL, user, pass string, cache *cache.Cache) Registry {
return ®istry{
baseURL: baseURL,
username: user,
password: pass,
cache: cache,
client: &http.Client{
Timeout: time.Second * 10,
},
}
}
With this change in place, the leaking routines were cleaned up after about 10 seconds.
While this works, there was one more one-line change to resolve this issue within the method that generates the HTTP requests. I was looking through the definition of the http.Request type and found the Close flag:
// request.go:197

// Close indicates whether to close the connection after
// replying to this request (for servers) or after sending this
// request and reading its response (for clients).
//
// For server requests, the HTTP server handles this automatically
// and this field is not needed by Handlers.
//
// For client requests, setting this field prevents re-use of
// TCP connections between requests to the same hosts, as if
// Transport.DisableKeepAlives were set.
Close bool
I decided to check what would happen if I set this flag to true and if it would prevent the locking of these goroutines. Here’s what it looked like in code:
func (r *registry) buildRequest(method, url string) (*http.Request, error) {
  req, err := http.NewRequest(method, url, nil)

  if err != nil {
    return nil, errors.Annotate(err, "failed to create http request")
  }

  req.SetBasicAuth(r.username, r.password)
  req.Close = true

  return req, nil
}
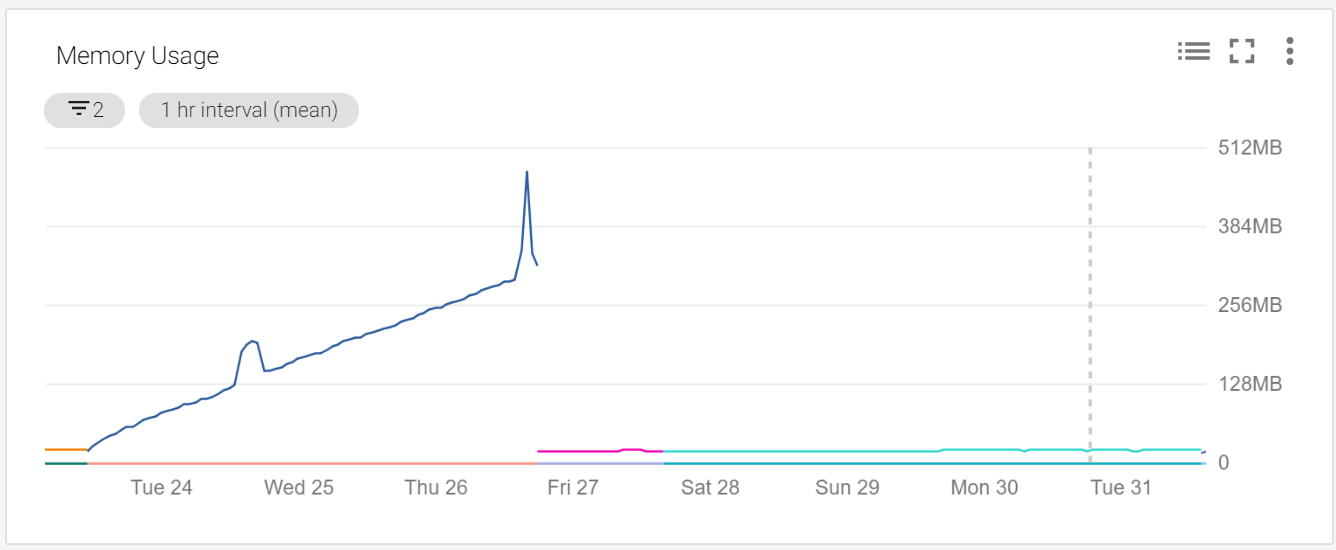
After implementing these changes and deploying it to production, the memory usage of the service stayed at a healthy amount forever more:

Lessons learned
- Monitor your number of active goroutines, especially in services that rely on concurrency patterns
- Add functionality to your services to expose profiling data using
pprof - Set reasonable configuration values for your HTTP clients and requests
Links
- https://www.ovoenergy.com/
- https://kubernetes.io
- https://cloud.google.com/
- https://cloud.google.com/stackdriver/
- https://kafka.apache.org/
- https://docs.confluent.io/current/schema-registry/docs/index.html
- https://avro.apache.org/
- https://www.postgresql.org/
- https://www.salesforce.com/
- https://github.com/google/pprof
- https://www.docker.com/
- https://github.com/gorilla/mux
- https://golang.org/src/net/http/transport.go